What Is the “Live Preview” Feature in PineGen AI and How Does It Work?
Author : Ranga Technologies
Publish Date : 3 / 17 / 2026 • 2 mins read
Last Updated : 3 / 17 / 2026

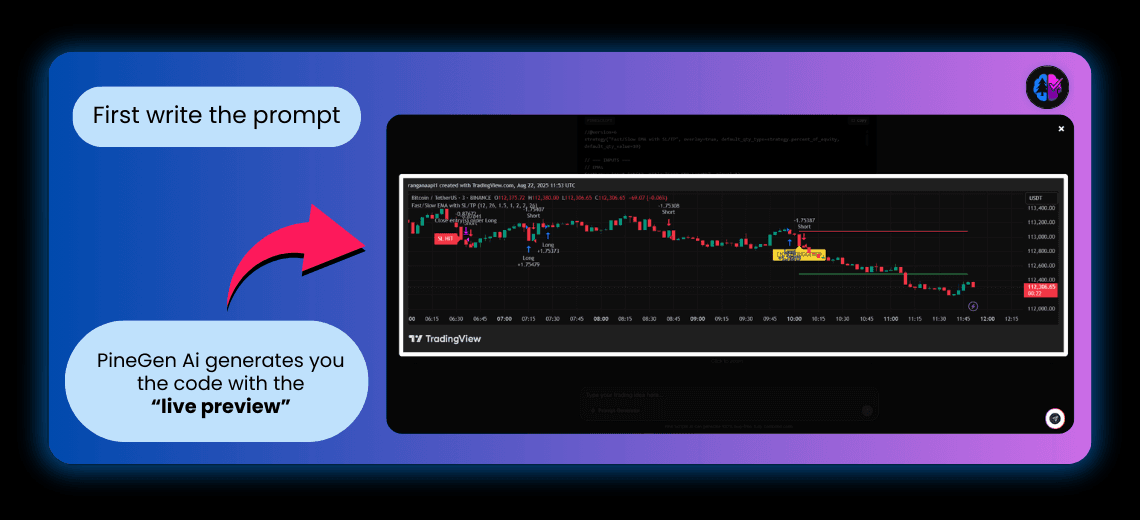
PineGen AI’s Live Preview shows the visual output of your generated Pine Script code right after you run a prompt. This lets you see whether your strategy logic or indicator plots work as expected — before copying anything into TradingView. It’s fast, reliable, and ideal for rapid development.
What Is PineGen AI?
PineGen AI is a natural-language code generator for Pine Script, the language behind TradingView indicators and strategies. By entering prompts like:
“Create a moving average crossover strategy with stop loss and take profit” — you get fully working Pine Script v5 code that’s ready to paste into TradingView.
Important: PineGen AI only generates code. It does not provide financial advice, live trading signals, or blog content tools. It’s built for traders and developers who want to prototype, build, and test strategies faster.
Explore it at: https://pinegen.ai
What Is the Live Preview Feature?
The Live Preview in PineGen AI is a real-time, in-browser chart that automatically appears after your Pine Script is generated. It shows what your code would look like if you pasted it into TradingView — but without the need to leave the PineGen platform.
This helps answer the critical question:
“Does this code actually work the way I expected?”
With Live Preview, you can quickly see plots, strategy entries, overlays, colored backgrounds, and indicator behavior right after generation.
How Does Live Preview Work?
Step 1: Enter a prompt
Try something simple like: “Plot a 50 and 200 EMA crossover strategy with green background when 50 is above 200.”
Step 2: Get generated Pine Script code
PineGen AI instantly returns code like this:
//@version=6

strategy("EMA Crossover", overlay=true)

ema50 = ta.ema(close, 50)

ema200 = ta.ema(close, 200)

bullish = ta.crossover(ema50, ema200)

bearish = ta.crossunder(ema50, ema200)

bgcolor(ema50 > ema200 ? color.new(color.green, 85) : na)

plot(ema50, color=color.blue)

plot(ema200, color=color.orange)

if (bullish)

strategy.entry("Buy", strategy.long)

if (bearish)

strategy.close("Buy")
Step 3: View the Live Preview
Immediately below the code, PineGen shows a chart with:
- Blue and orange EMA lines
- Green background when 50 EMA is above 200
- Strategy entry and exit markers
You can visually verify that the crossover logic and entries are working correctly — all without opening TradingView.
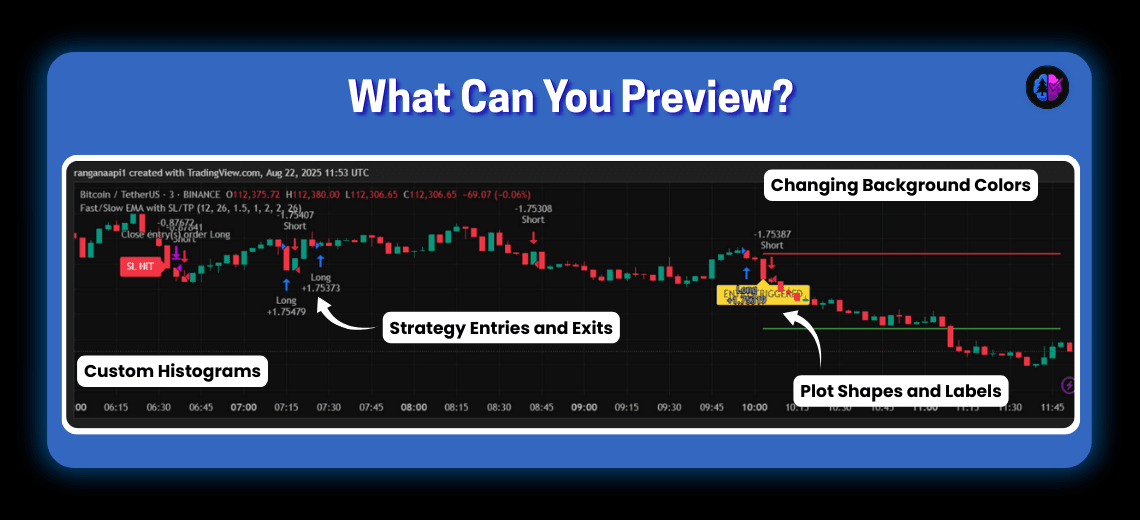
What Can You Preview?
Instead of abstract lists, here are code examples that directly show what Live Preview supports:
Indicator Plots
You’ll see line indicators like:
plot(ta.rsi(close, 14), title="RSI", color=color.purple)
These appear instantly in the chart preview — no delay, no setup.
Strategy Entries and Exits
The following creates visible trade markers:
strategy("Simple MACD Strategy", overlay=true)

[macd, signal, _] = ta.macd(close, 12, 26, 9)

long = ta.crossover(macd, signal)

short = ta.crossunder(macd, signal)

strategy.entry("Long", strategy.long, when=long)

strategy.entry("Short", strategy.short, when=short)
The preview displays green/red arrows where entries and exits occur.
Background Colors
Conditional visual zones are supported:
rsi = ta.rsi(close, 14)
bgcolor(rsi > 70 ? color.red : rsi
When RSI is overbought or oversold, the background changes — instantly viewable in the preview.
Plot Shapes and Labels
Use these to mark conditions visually:
plotshape(ta.crossover(close, ta.sma(close, 20)), location=location.belowbar, color=color.green, style=shape.triangleup)
This adds triangle markers below bars when price crosses above the SMA.
Custom Histograms
Bar-style outputs are also previewed:
[macdLine, signalLine, _] = ta.macd(close, 12, 26, 9) plot(macdLine - signalLine, style=plot.style_columns, color=color.blue)
Histograms render correctly in Live Preview for quick logic checks.
What Live Preview Does Not Support
Live Preview is powerful, but it’s not a full Pine Script editor. Here’s what it does not do:
- No code editing inside the preview window
- No full backtest metrics (use TradingView for that)
- No alert testing (visual markers only)
It’s a visual validator, not a replacement for TradingView’s script editor.
Why Live Preview Is So Useful
Live Preview helps both beginner and advanced users:
-
For beginners, it’s a visual learning tool. You can see what each part of the code does without debugging manually.
-
For experienced coders, it’s a rapid prototyping tool. You can test logic, confirm signals, and adjust prompts faster.
It’s also ideal for catching mistakes early. For example, if you prompt:
“Create a Supertrend with RSI filter and buy alerts”
…but forget to specify thresholds, you might get:
if ta.crossover(close, supertrend) and rsiFilter
strategy.entry("Buy", strategy.long)
The Live Preview will make it obvious that signals aren’t triggering — so you can immediately refine your prompt.
Why It Matters for Traders and Developers
If you’ve ever wasted time copying code into TradingView just to realize it’s plotting the wrong thing, this feature will change your workflow.
Live Preview lets you:
- Catch logic errors early
- Validate plots and entries
- Iterate prompts faster
- Build smarter, cleaner scripts
It’s one of PineGen AI’s most powerful features for cutting down the idea-to-deployment cycle.
Try These Prompts Today
Here are a few ideas to test with Live Preview:
- “Build a VWAP indicator with colored candles based on price above/below”
- “Create a trend-following strategy using 21 EMA and ADX > 20”
- “Plot Bollinger Bands with RSI divergence markers”
Each will give you code and a real-time visual output — ready to copy to TradingView if it looks good.