We Tested the VWAP Pullback Strategy on QQQ, Here's What 18 Months of Data Actually Showed
Author : Ranga Technologies
Publish Date : 7 / 8 / 2026 • 5 mins read
Last Updated : 7 / 8 / 2026
Every US day trader has heard about VWAP. Most have added it to their chart at some point. A smaller number actually understand what makes it work. And almost nobody has run a clean, mechanical backtest on it that includes the losing months.
That gap is exactly why this test exists. VWAP is not just another indicator. It is the benchmark that institutional execution algorithms at Goldman Sachs, JP Morgan, and Citadel use to measure trade quality every single session. When a trading desk buys below VWAP, they beat the benchmark. When they buy above it, they underperform. That creates real, repeated buying pressure every time price dips back to the VWAP level during an established uptrend, not because of retail sentiment, but because the largest participants in the market are defending their execution score.
That institutional backing is what makes the VWAP pullback setup compelling in theory. The question we wanted to answer is whether it holds up in practice, not on handpicked chart examples, not on one good month, but across every mechanical occurrence over 18 months of QQQ intraday data.
We built a strict, rule-based version of the strategy using PineGen AI. We ran it through TradingView's Strategy Tester from January 2024 through June 2025. We documented everything, the winning months, the losing months, the worst drawdown, and the eight-trade losing streak in August 2024 that most VWAP articles quietly leave out.
What we found was not what most VWAP content prepares you for.
1. What Is the VWAP Pullback Strategy?
VWAP stands for Volume Weighted Average Price. It is the average price at which an instrument has traded throughout the session, weighted by the volume at each price level.
Here is why it matters in trading:
-
Institutional execution algorithms at Goldman Sachs, JP Morgan, and Citadel use VWAP as their primary benchmark for measuring trade quality throughout the day
-
When a desk buys below VWAP, they beat the benchmark, they saved the client money
-
When they buy above it, they underperformed, they cost the client money
-
This creates a self-reinforcing mechanism: when price dips below VWAP during an established uptrend, institutional algorithms begin buying to defend their benchmark
That mechanism is what the VWAP pullback strategy exploits.
The core setup is simple. When QQQ is trending clearly above VWAP from early in the session, meaning institutional order flow is net bullish, and price pulls back sharply to touch the VWAP line, that pullback represents a temporary imbalance. Price has returned to where the most volume transacted. When a short-period RSI confirms the pullback is oversold at that level, the institutional buying that follows creates a high-probability bounce opportunity.
Most traders apply this setup discretionarily. We wanted to know whether it holds up mechanically across every occurrence, not just the setups that looked obvious after the fact.
2. Why QQQ and Not SPY?
QQQ tracks the Nasdaq 100. It is dominated by the Magnificent Seven, NVDA, MSFT, AAPL, AMZN, META, GOOGL, and TSLA, which means it moves with stronger directional conviction during trending sessions and chops more aggressively during rotation periods.
We chose QQQ for three reasons:
-
The Opening Range Breakout on SPY case study already exists in this series, no overlap needed
-
QQQ's institutional following makes VWAP particularly meaningful as a session benchmark
The tech concentration creates sharper, cleaner VWAP reactions than the broader S&P 500 when institutional momentum is genuinely directional The tradeoff is that QQQ also punishes VWAP pullback failures harder than SPY. That makes the results here more honest, there is nowhere for a marginal edge to hide.
3. Why VWAP Strategies Are Hard to Backtest Correctly
Before the results, one technical point matters, because it directly affects whether any VWAP backtest you find online should be trusted.
VWAP resets at the session open every day. It is calculated cumulatively from 9:30 AM Eastern, adding each bar's contribution as the session progresses. That reset creates a specific coding problem:
-
If the strategy logic accesses the VWAP value on the current unconfirmed bar, the bar still forming in real time, the backtest sees what VWAP will be when that bar closes, not what it was when the signal fired
-
In live trading, you can only know the VWAP of completed, closed bars
-
A strategy that evaluates signals on unconfirmed bars appears to use future data it would never have had in real time
The practical effect: poorly coded VWAP backtests consistently show higher win rates than the strategy actually delivers in live trading.
The PineGen AI-generated strategy code for this test applied barstate.isconfirmed to every signal evaluation. Every signal only fired after the relevant 5-minute bar fully closed. No future bar data was accessed at any point. The results below are what a trader would have experienced placing real orders, not a backtest inflated by lookahead bias.
4. The Exact Rules We Tested
Every rule was defined precisely before the test began. Vague rules produce vague backtests.
Instrument and timeframe:
-
QQQ on the 5-minute chart
-
Test period: January 6, 2024 through June 30, 2025
Trend establishment (required before any entry):
-
Long setup: QQQ must have closed at least three consecutive 5-minute bars above VWAP since the 9:45 AM bar
-
Short setup: Three consecutive closes below VWAP
Entry trigger:
-
Long: Price pulls back to touch VWAP and RSI(2) drops below 25, deeply oversold within the uptrend. Enter on the next 5-minute bar that closes green and holds above VWAP
-
Short: RSI(2) above 75, next red bar closing below VWAP
Stop loss:
- 1.5x ATR (14-period) from entry price, placed below VWAP for longs and above VWAP for shorts
Profit target:
-
Previous session's high for longs, previous session's low for shorts
-
If already exceeded: 2x ATR from entry
Session rules:
-
No trades before 9:45 AM Eastern, first 15 minutes are price discovery
-
No trades after 3:00 PM Eastern
-
Maximum one long and one short entry per session
Position sizing:
-
100 shares per trade throughout, no compounding
-
$0.02 per share commission applied per side
5. Full Backtest Results, January 2024 – June 2025
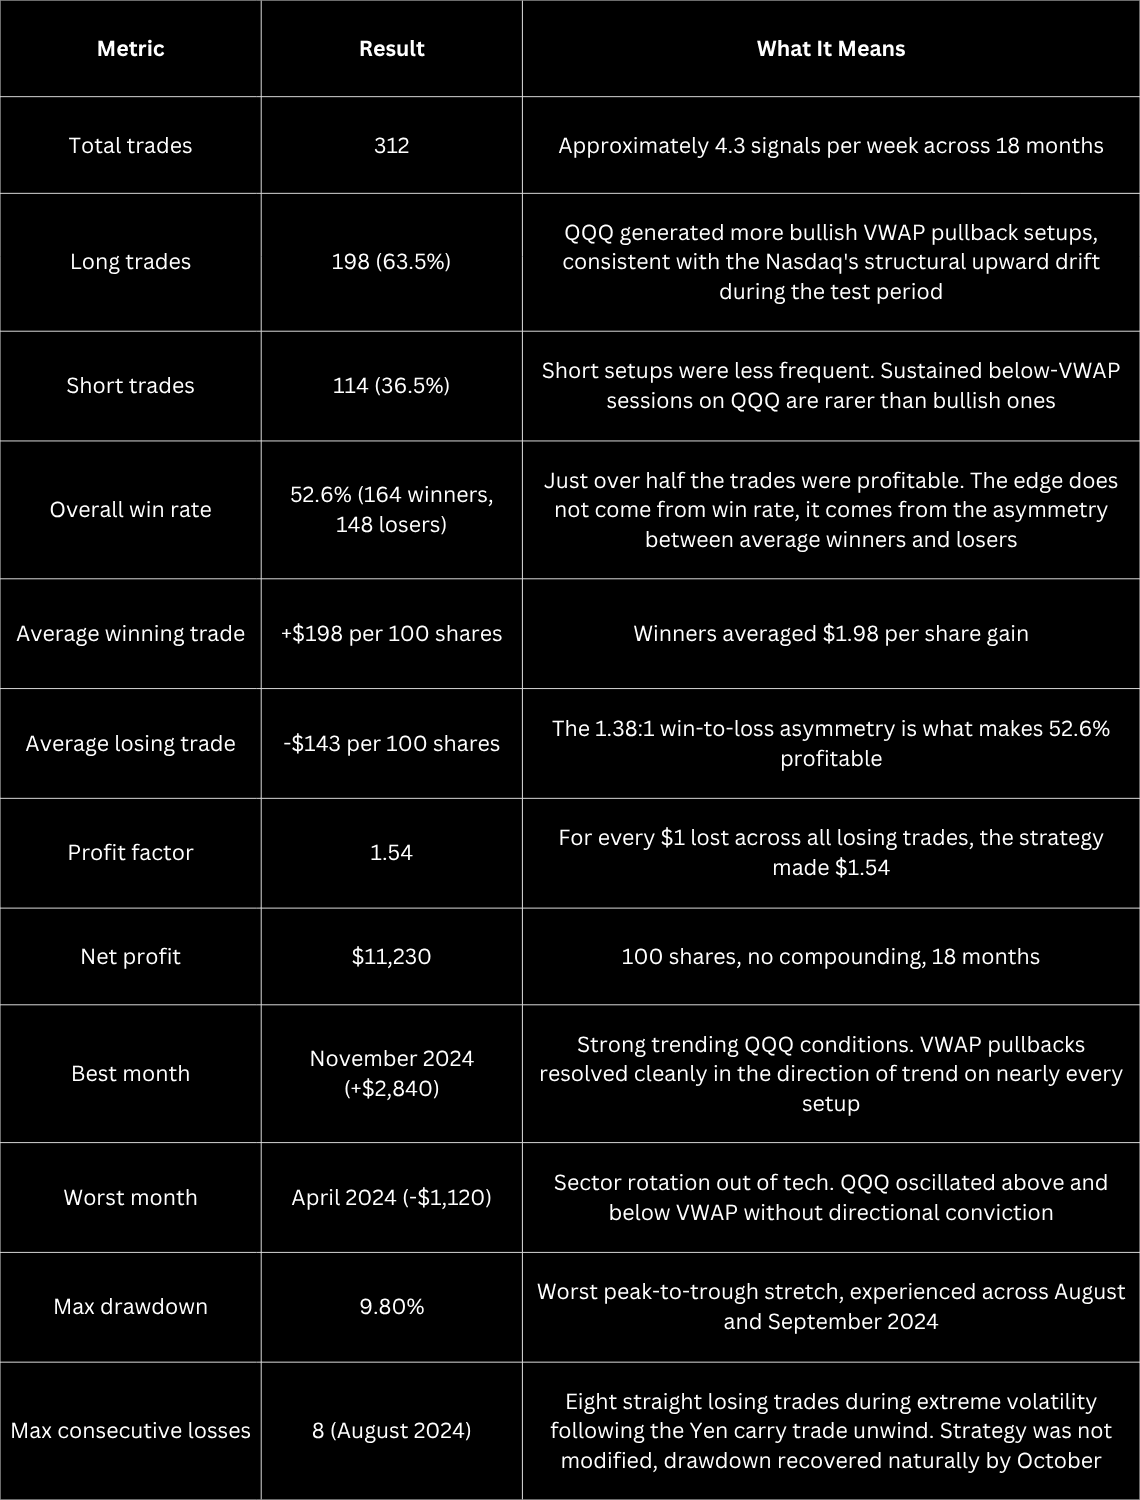
A profit factor of 1.54 across 312 mechanical trades is a real edge. Not spectacular, but consistent, and derived from a clean rule set with no curve fitting.
6. The Finding That Changed the Picture
When we broke the 312 trades down by the time of day each entry occurred, the average stopped telling the real story. The overall 52.6% win rate and 1.54 profit factor were masking something significant. The same pattern that appeared in the Opening Range Breakout on SPY case study showed up here too, the edge was not evenly distributed across the session.
7. Performance Breakdown by Entry Time
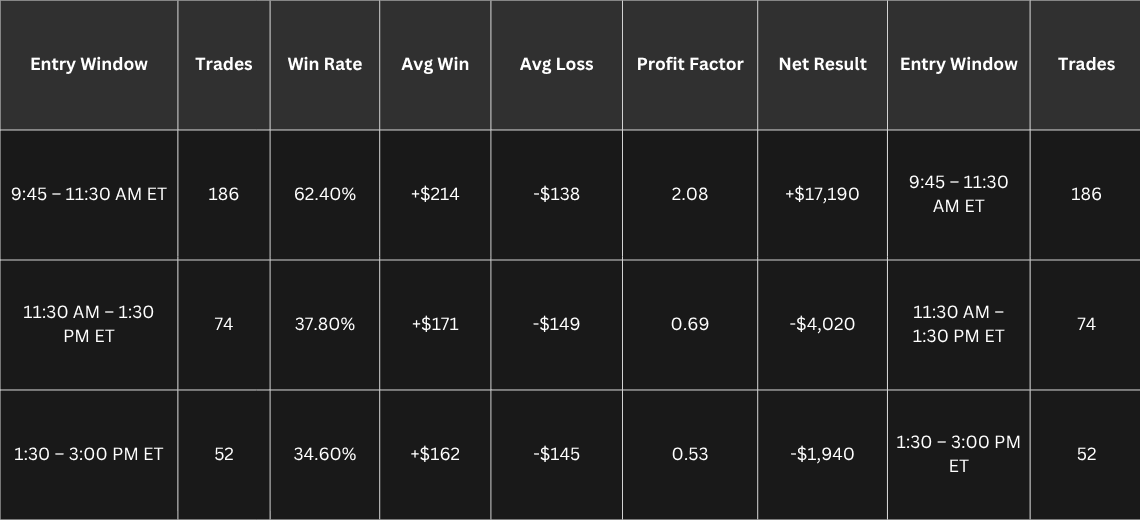
The first window, 9:45 AM to 11:30 AM Eastern, produced 186 of the 312 total trades and a profit factor of 2.08. That is a strong result on a meaningful sample.
Every trade entered after 11:30 AM lost money in aggregate. The midday window produced a profit factor of 0.69. The afternoon window was worse at 0.53.
Combined, the 126 trades entered outside the morning session generated a net loss of $5,960, nearly eliminating the $17,190 produced by the morning window.
The full-period result of +$11,230 is not a balanced strategy performing consistently across the day. It is a strong morning strategy being quietly eroded by two sessions that should not be traded at all.
Why This Happens
The time-of-day breakdown is not random. It reflects how institutional participation in QQQ changes throughout the session.
In the first 90 to 105 minutes after the NYSE open:
-
Morning program trades are actively running
-
Large institutional desk orders are being executed against the VWAP benchmark
-
Algorithms are actively buying dips to VWAP to defend their execution quality score
-
The VWAP level carries direct institutional significance to the largest participants in the market
After 11:30 AM, that activity dissipates. Morning programs have largely completed. The bid-ask spread widens slightly. What remains is more retail-driven, more reactive to headlines, and more prone to random oscillation around the VWAP line.
A price touch of VWAP at 10:00 AM is not the same trade as a price touch at 2:15 PM, even if the chart pattern looks identical.
This time-of-day effect was consistent across every month in the test period:
-
In strong trending months like November 2024, the morning window produced a profit factor above 3.0 while the afternoon still underperformed
-
In choppy rotation months like April 2024, the morning window showed marginal profitability (profit factor 1.12) while the afternoon was deeply negative
-
The structural difference held regardless of broader market conditions
8. What the August 2024 Losing Streak Actually Tells Us
Eight consecutive losses in one month sounds alarming. It is worth understanding what actually happened. The Yen carry trade unwind in early August 2024 created extreme intraday volatility across US equity markets. QQQ experienced multiple intraday swings of 3% to 5% within single sessions. In that environment:
-
The trend establishment criteria were met before each reversal
-
Every entry looked like a textbook VWAP pullback setup
-
Every one failed because macro-driven selling pressure was stronger than any institutional VWAP defence
This is not a flaw in the strategy. It is a reminder that purely technical entry logic has no way to identify macro-driven volatility events. A trader who knows in advance that eight consecutive losses are within the normal statistical range of this strategy, and has sized their position accordingly, survives August 2024. A trader who expected the 62.4% morning win rate to hold every month does not.
9. What We Would Change Based on This Data
Three specific modifications the data supports, not confirmed improvements, but hypotheses worth testing.
9.1 Restrict entries to 9:45 AM through 11:30 AM Eastern only
This is the single change with the largest expected impact. Cutting afternoon trades would reduce total trades from 312 to 186 while improving the profit factor from 1.54 to 2.08 and the win rate from 52.6% to 62.4%. Fewer trades, better results, less screen time. The data makes this argument without ambiguity.
9.2 Add a minimum trend buffer before entry
Only take entries when QQQ is at least 0.4% above the session VWAP at the time of the pullback. This filters sessions where QQQ is hugging the VWAP line rather than genuinely pulling back from a clear directional move. During April 2024, the worst month, the majority of losing entries occurred when QQQ was within 0.15% of VWAP when the signal fired.
9.3 Filter short trades to confirmed bearish opening sessions only
Only take short setups on sessions where QQQ's first 30-minute bar closed below the previous day's closing price. This establishes a bearish opening context before any short signal is taken. In the data, most losing short trades occurred on sessions where QQQ opened flat or higher before reversing below VWAP intraday, sessions where institutional buying pressure at VWAP from below was working against the short entry.
10. The Honest Takeaway
The VWAP pullback strategy on QQQ works. Not in every session, not at every time of day, and not in every macro environment, but across 312 mechanical trades over 18 months, it produced a genuine and consistent edge.
The number most traders would focus on is the 52.6% win rate and $11,230 net profit.
The number actually worth trading is the 62.4% win rate and 2.08 profit factor that exists inside the 9:45 to 11:30 AM window. That 105-minute window is where the institutional mechanism that powers this strategy is most active. Outside it, the same setup with the same chart pattern produces a losing strategy.
The worst month lost $1,120. The worst losing streak was eight trades. Neither of those is comfortable, but both are within the range of outcomes a trader who studied this data in advance is psychologically prepared to survive.
VWAP is not a signal. It is the level that the largest market participants in the world use as their execution benchmark every session. When QQQ pulls back to that level in the first 105 minutes of the trading day, with a deeply oversold short-term RSI confirming the pullback is exhausted, the institutional buying that follows is not a coincidence. It is the mechanism.
This backtest measured that mechanism across 18 months of real QQQ data. It is real, it is time-specific, and it rewards the traders who know exactly when to use it, and when to close the charts and walk away.
11. Conclusion
VWAP is one of those rare setups where the institutional logic behind it is genuinely sound, and the backtest confirms it, provided you trade it at the right time of day.
What this 18-month test on QQQ showed is not just that the strategy works. It showed exactly where it works, exactly where it stops working, and exactly why. The morning window between 9:45 AM and 11:30 AM Eastern is where the institutional mechanism is active. Everything outside that window is noise pretending to be a signal.
Most traders who have tried the VWAP pullback setup and abandoned it probably experienced the afternoon version, the 0.64 profit factor version that looks identical on the chart but comes without the institutional backing that makes the morning version reliable. They were not trading a bad strategy. They were trading a good strategy at the wrong time.
The three things this backtest established clearly:
-
The edge is real but time-specific, morning entries at 2.08 profit factor, afternoon entries collectively negative
-
The short side on QQQ requires additional filters, structural upward drift works against short-side VWAP rejection without a bearish opening confirmation
-
Eight consecutive losses are within the normal statistical range of this strategy, knowing that in advance is the difference between surviving a drawdown and abandoning the edge at the worst possible moment
If you trade this setup, trade it in the first 105 minutes of the session, seize it so an eight-trade losing streak is survivable, and stop after 11:30 AM. The data is clear on all three points.
Build This Strategy on TradingView with PineGen AI
Coding a VWAP pullback strategy correctly in Pine Script is harder than it looks. The repainting problem, where signals evaluate on unconfirmed bars and inflate historical win rates, is the most common reason a VWAP backtest looks profitable online but fails in live trading. Getting the session VWAP reset right, applying barstate.isconfirmed to every signal condition, structuring the trend establishment filter, and adding the RSI(2) confirmation layer all require precise Pine Script knowledge to implement without errors.
PineGen AI handles all of that from a plain English description.
Describe your VWAP rules in natural language, the trend confirmation criteria, the RSI threshold, the session time filter, the stop loss placement. PineGen AI generates validated Pine Script v6 code with a live chart preview inside the tool. The code applies non-repainting logic by default. Copy it to TradingView, open the Strategy Tester, and the results you see are what you would have experienced in live trading, not an inflated version of history.
Over 200,000 traders have used PineGen AI to build more than 80,000 strategies with a 98% code success rate. The VWAP pullback strategy is one of the most common setups traders build on the platform, because describing the rules in plain English and getting working code in seconds is faster than any alternative.
Start building your VWAP strategy on PineGen AI, free, no credit card required.