Your TradingView Backtest Is 30–50% More Optimistic Than Reality, Here's the Exact Fix
Author : Ranga Technologies
Publish Date : 6 / 30 / 2026 • 5 mins read
Last Updated : 6 / 30 / 2026
Your TradingView backtest looks better than live results because of three default settings: commission is zero, slippage is zero, and position sizing defaults to 100% of equity. Fix all three in Strategy Tester → Settings → Properties before trusting any number. After applying realistic values your reported returns will drop 30–50%, those lower numbers are the accurate ones.
There is a moment that almost every TradingView trader experiences exactly once. You have spent weeks, sometimes months, building a strategy. You have watched it run through historical data and produce a beautiful equity curve. The numbers look strong: consistent profits, a win rate you are proud of, a drawdown you can live with. You feel ready. You switch it on with real money.
And then the real results arrive, not catastrophically different, not completely broken, just consistently and stubbornly worse than everything the backtest told you to expect.
This is not bad luck. It is not primarily a change in market conditions. In most cases it is something far more specific and entirely fixable: the default settings inside TradingView's Strategy Tester are configured for mathematical convenience, not real-world accuracy. The gap between those two things is well documented and entirely predictable.
Research from EBC Financial Group (April 2026) confirms that a 20–50% reduction in performance is common when transitioning from backtest to live trading. TV-Hub's 2026 guide states that live trading results typically degrade to 60–70% of what backtests show on default settings. A developer documented a USDJPY strategy where three misconfigured settings made the backtest 40% more optimistic than live results, not because the strategy was wrong, but because the testing environment was not designed to reflect reality.
This guide explains every cause behind that gap and gives the exact fix for each one.
1. What TradingView's Strategy Tester Actually Does, And What It Does Not
When you apply a Pine Script strategy to a TradingView chart, the Strategy Tester replays your rules against stored historical price data. Bar by bar, it evaluates whether your entry conditions are met, simulates an order being placed, records the fill, then tracks the trade until your exit conditions trigger. It generates a performance report covering net profit, win rate, drawdown, profit factor, Sharpe ratio, and dozens of other metrics.
The mathematics of this process are correct. TradingView is not making arithmetic errors. It genuinely runs your strategy through past data and calculates what would have happened if every order filled exactly as specified, with no friction costs, under whatever defaults are active.
That phrase, "exactly as specified, with no friction costs", is the entire problem. The defaults specify a world that does not exist. Real trading has fees on every transaction. Real orders have a gap between expected price and actual fill price. Real position sizing changes as your account balance changes. Making the backtest honest about the real market is entirely the trader's responsibility, and the software does not tell you what it needs to do.
NOTE: TradingView's Strategy Tester is a completely honest simulation of an imaginary market. Making it honest about the real market is the trader's job, and most traders never do it.
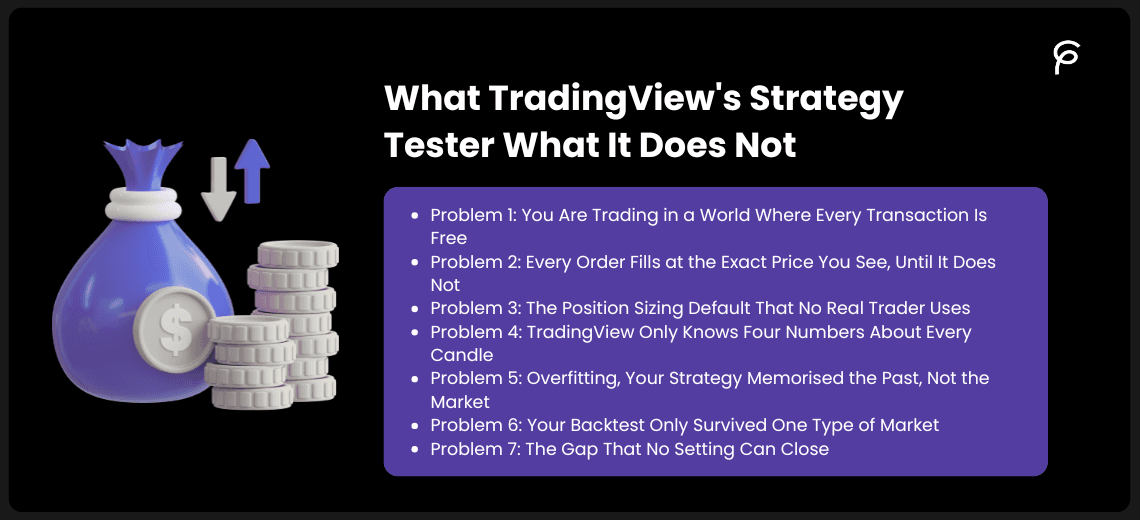
2. Problem 1: You Are Trading in a World Where Every Transaction Is Free
The single biggest driver of the backtest-to-live gap is commission. By default, TradingView's Strategy Tester runs with commission set to exactly zero. Every trade in your backtest is executed with no broker fee, no exchange fee, no spread cost, and no transaction charge of any kind. The strategy buys and sells as if those costs do not exist.
To understand why this creates such large distortions, you need to understand how transaction costs compound across a full backtest period.
Imagine a strategy that makes 200 trades per year. Each trade involves a 0.1% commission on entry and 0.1% on exit, a total round-trip cost of 0.2%. On a single trade, that sounds small. Multiplied across 200 trades, the total commission drag is 40% of gross profit. A strategy reporting 50% annual returns in the zero-commission backtest would need to generate 90% gross profit to return 50% after real fees. If the actual edge only generates 55% gross profit, the reported 50% net return evaporates to 15% in live trading.
This is the mechanism behind the +132% to +3.28% collapse. The strategy made many small winning trades. Each looked profitable with zero commission. With realistic fees applied, the margin on each trade vanished. The edge was real, just much smaller than the default backtest showed.
REAL CASE STUDY (TV-Hub, 2026): A strategy showed +132% annual returns with default zero-commission settings. When realistic commission was applied to the same strategy and data: +3.28%. 97.5% of reported profit was fictitious, from a single settings change.
For strategies that trade frequently, scalping setups, mean-reversion systems, intraday approaches, costs compound far more rapidly. A strategy placing 50 trades per day with 2 pips of total spread cost per trade loses 100 pips per day to friction alone. If the strategy's gross edge produces 2,500 pips per month, 80% of it is consumed before a single cent of live profit is recorded. Pineify's research team stated this directly: "if you're backtesting a scalping strategy with 50 trades a day and you're not factoring in 2–3 pips of slippage per trade, your results are fictional."
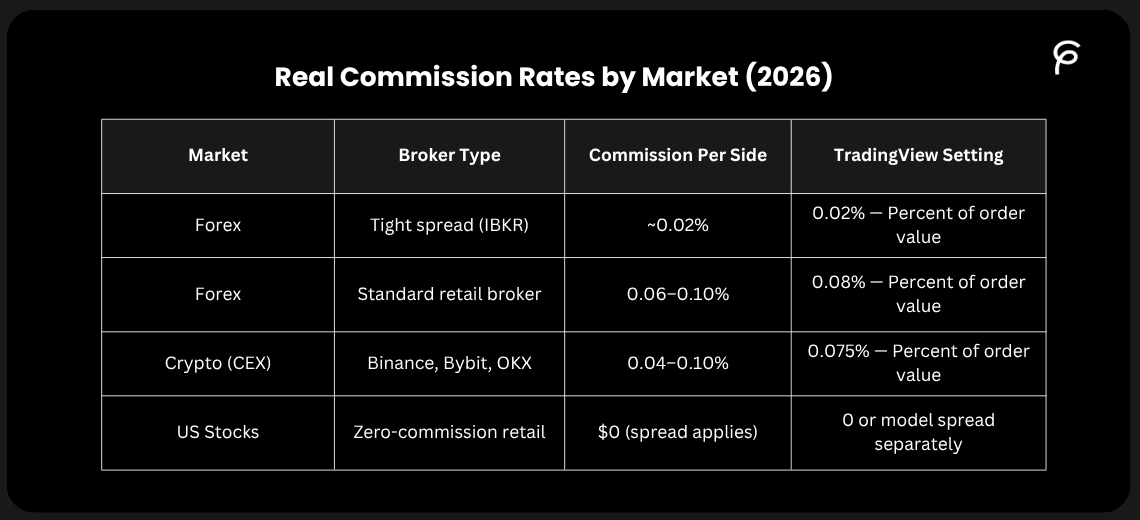
3. Real Commission Rates by Market (2026)
4. How to Fix Commission in TradingView
Step 1: In your chart, open the Strategy Tester panel at the bottom. Click the gear icon (Settings). Step 2: Navigate to the Properties tab. Step 3: Find Commission. Change Type to "Percent of order value." Enter your broker's actual rate. Use 0.1% if unknown. Step 4 (Important): UI settings override Pine Script code. If the code says commission_value=0 but Properties shows 0.1%, the UI wins. Always verify in Properties after opening any strategy.
5. Problem 2: Every Order Fills at the Exact Price You See, Until It Does Not
The second default assumption is slippage, also set to zero. Slippage is the difference between the price your strategy specifies and the price you actually get filled at in a live market. In a zero-slippage backtest, if the strategy says "buy EURUSD at 1.0850," TradingView records a fill at exactly 1.0850. Every time. Without exception.
Real markets never work this way. There are four structural reasons why:
6. The Four Causes of Slippage in Live Trading
6.1 CAUSE 1 - THE BID-ASK SPREAD
At any moment two prices exist: the bid (highest price a buyer will pay) and the ask (lowest price a seller will accept). When your strategy places a market buy order, you fill at the ask, slightly above the mid-price shown on your chart. When it places a market sell, you fill at the bid, slightly below the mid-price. This spread cost is paid on every single entry and every exit, invisibly in the default backtest. On EURUSD in normal conditions, the spread might be 0.5 to 1.0 pip, meaning every round-trip trade costs at least 1.0 pip before any market movement can produce profit. For a strategy targeting 5-pip gains per trade, 1 pip of spread represents 20% of the target profit consumed by execution cost alone.
6.2 CAUSE 2 - MARKET IMPACT
Placing an order absorbs available liquidity at the best price. If the order is larger than the quantity offered at the best bid or ask, the remaining portion fills at the next best price, which is slightly worse. Negligible for small retail positions on liquid instruments, but meaningful on smaller-cap assets, less liquid instruments, or any position that represents a significant fraction of typical volume.
6.3 CAUSE 3 - LATENCY
There is always a time delay between when a signal fires and when the order actually fills. During this delay, the market continues to move. During high-volatility events, the same major forex pairs that slip 1–2 pips in normal conditions can slip 5–10 pips during the latency window. Research from LuxAlgo (2025) specifically documented that under stress conditions, major FX pairs regularly experience gaps of 5–10 pips in the window between signal generation and order execution, gaps that do not exist in any zero-slippage backtest.
6.4 CAUSE 4 - BAR-OPEN EXECUTION TIMING
Many strategies enter on the open of the next bar after a condition is met on the previous bar close. In a backtest, the bar open is a precise, known number that the strategy fills at exactly. In live trading, the bar open is a fast, contested moment where many orders arrive simultaneously. The actual fill can be 1–5 ticks away from the theoretical bar open price. This is particularly pronounced at significant time boundaries, the 9:30 AM US market open, the 8 AM London open, where order flow concentration is highest.
DEVELOPER CASE STUDY (Supa.is, March 2026): Commission added → net profit dropped from +18.7% to +11.2%. Then 2 ticks of slippage added → net profit dropped by a further ~8%. Total reduction from default to realistic settings: over 40%. After all corrections: backtest came within 5–10% of live trading performance.
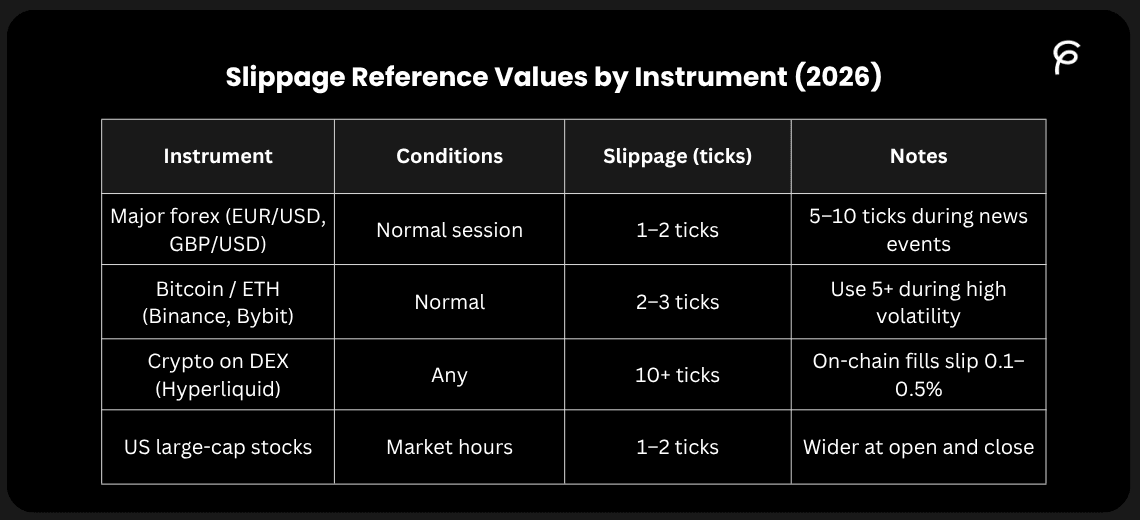
7. Slippage Reference Values by Instrument (2026)
CALIBRATION TIP: Track your first 20–30 live fills. Record the difference between expected fill price (signal price) and actual fill price for each trade. Average those differences. Use that average as your slippage setting. This turns your backtest into a simulation calibrated specifically to your broker, instrument, and strategy type.
8. Problem 3: The Position Sizing Default That No Real Trader Uses
TradingView's Strategy Tester defaults to allocating either $1,000 fixed per trade or 100% of equity per trade, depending on the script. Neither reflects how any risk-managed trader actually operates, and both distort backtest results in ways that go far beyond simple magnitude differences.
9. Why 100% Equity Per Trade Is the Most Dangerous Default
The 100% of equity default invests your entire simulated account balance into every single trade. For a backtest starting with $10,000, every position is a $10,000 position. This produces the maximum possible return on every winning trade and the maximum possible loss on every losing trade. The reported equity curve tracks the outcome of a strategy running at 10–20 times the leverage any real trader would use.
Winning streaks compound upward dramatically because each win increases the base from which the next 100% position is calculated. But losing streaks also compound downward catastrophically. The backtest handles this mathematically without any of the practical constraints real trading imposes, no margin calls, no psychological limits, no rule-based position reduction.
WARNING: Never evaluate a strategy whose backtest ran on 100% equity position sizing. It produces the highest possible returns while being completely incompatible with real risk management. The reported numbers are mathematically consistent but practically meaningless.
10. Why Fixed Dollar Sizing Understates Real Drawdown
The fixed dollar default ($1,000 per trade) creates a different distortion. Real accounts grow and shrink. When your account grows from $10,000 to $15,000, you take proportionally larger positions to maintain the same percentage risk. When it draws down to $7,000, positions should shrink to limit further damage. Fixed sizing captures neither dynamic.
This specifically affects drawdown measurement. When a real trader draws down using percentage-based sizing, every subsequent trade is smaller than at peak equity, naturally limiting further losses. The fixed-sizing backtest does not do this: it continues trading the same size regardless of account health. Drawdown statistics from fixed-sizing backtests consistently understate how bad the damage would feel in a real account.
11. How to Fix Position Sizing in TradingView
Step 1: In Properties, find Order Size. Change from "Contracts" or "USD" to % of equity.
Step 2: Set the percentage to 1–5% depending on your actual risk per trade. 1–2% is conservative and sustainable. 5% is aggressive but used by some systematic traders with proven strategies.
Step 3: Set Initial Capital to the actual dollar amount you plan to trade. Running a backtest on the default $100,000 when you plan to trade $5,000 produces meaningless absolute dollar figures and misleading percentage calculations.
12. Problem 4: TradingView Only Knows Four Numbers About Every Candle
This problem is more technical than the first three but is responsible for a specific class of errors that no settings change can fully eliminate, only reduce. When TradingView backtests on historical data, it processes each candle as exactly four numbers: Open, High, Low, Close (OHLC). That is all the information it has. It does not know when within the bar the High occurred. It does not know whether the High came before the Low. It has no tick-by-tick price path. It cannot reconstruct what happened between the open and the four known extremes.
TradingView must therefore make assumptions to fill these gaps. When a strategy has a stop loss and a take profit that could both be hit within the same candle, the Strategy Tester has to guess which came first. That guess is frequently wrong.
A Concrete Example of the OHLC Trap
Your strategy enters long at $100 on the bar open. Stop loss at $95. Take profit at $108. The candle prints: Open $100, High $112, Low $93, Close $105. Both the stop ($93 is below $95) and take profit ($112 is above $108) were theoretically reached within this single candle. TradingView must guess which came first.
If it assumes High before Low: take profit hit at $108, you record an $8 WIN. If in reality the Low came first: stop hit at $95, you suffered a $5 LOSS.
One candle. Same strategy. Opposite outcomes, from a guess about intrabar sequencing. Multiply this across hundreds of trades in an intraday backtest and the cumulative effect is substantial.
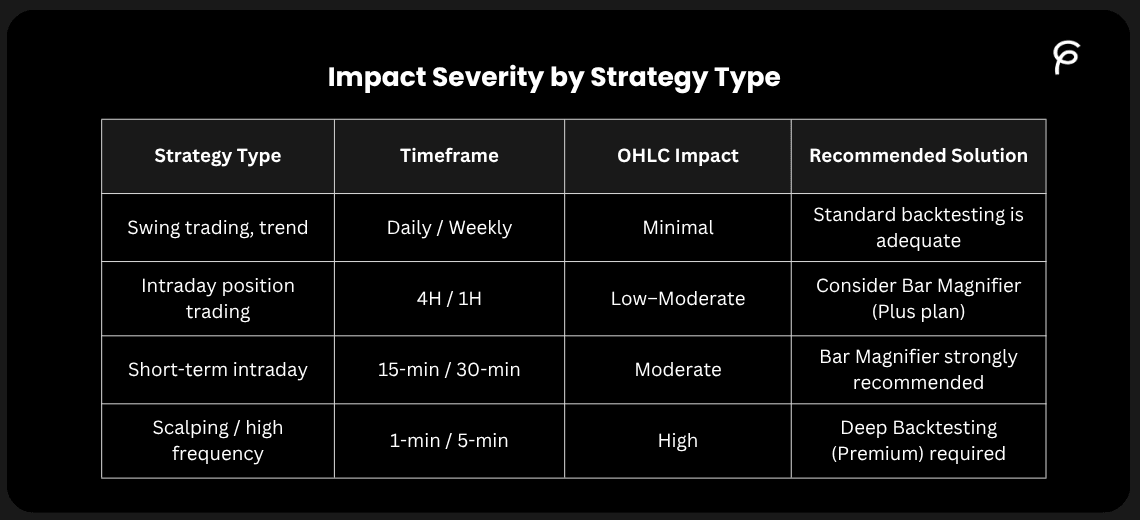
Bar Magnifier (Plus plan, ~$29.95/month): Pulls in lower-timeframe data to reconstruct intrabar price movement. Add use_bar_magnifier=true to your Pine Script strategy declaration.
Deep Backtesting (Premium plan, ~$59.95/month): Uses actual tick-by-tick historical data. Eliminates virtually all intrabar assumption errors. Strongly recommended for any strategy trading below the 1-hour timeframe.
13. Problem 5: Overfitting, Your Strategy Memorised the Past, Not the Market
Overfitting, also called curve fitting, is the most seductive trap in backtesting because it feels exactly like genuine progress. Every time you adjust a parameter and the backtest improves, you feel like you are discovering something real about how markets work. In most cases, you are discovering the parameter combination that happened to match the noise in a specific historical dataset. That is a completely different thing.
14. How the Typical Overfitting Cycle Unfolds
A trader starts with a moving average crossover strategy. Initial results are mediocre, 43% win rate, modest returns over five years. They change the fast MA from 9 to 12. Better. They add an RSI filter. Better. They change the RSI period from 14 to 11. Better. They add a volume condition. Better. After three weeks of iteration, the backtest shows a 67% win rate and 28% annual returns with a Sharpe ratio of 1.5.
They run the strategy forward on six months of out-of-sample data. It barely breaks even.
Every change they made implicitly fitted the strategy to the past. The strategy became a perfect description of what already happened in that specific dataset. Because markets change, the strategy had no predictive power beyond the period it was fitted to.
15. Warning Signs Your Strategy Is Overfitted
15.1 WARNING SIGN 1 - PARAMETER SENSITIVITY
The clearest test of overfitting is what happens when you change a parameter slightly. If your strategy shows excellent results with an RSI period of 11, change it to 10. Then to 12. If performance drops dramatically at either adjacent value, the strategy is not robust, it has found the parameter value that fitted historical noise, not a stable market characteristic. Genuine market edges are stable across a reasonable range of parameter values.
15.2 WARNING SIGN 2 - SUSPICIOUSLY SMOOTH EQUITY CURVE
Real strategies have rough patches, clustering losses, and extended drawdown periods. A backtest equity curve that ascends at a perfectly consistent angle, with no prolonged flat or negative periods, has almost certainly been fitted to the data in a way that averages out the real randomness.
15.3 WARNING SIGN 3 - SINGLE-REGIME PERFORMANCE
A strategy tested exclusively on 2020–2023 bull market data has been shown in one chapter of market history. It has not been tested at all, it has been verified that it fits one specific environment. Every market environment it has not been tested in is an unknown that could collapse performance.
15.4 WARNING SIGN 4 - EXCESSIVE PARAMETER COUNT
The more parameters a strategy has, the more opportunities there are to accidentally overfit each one to historical noise. Research consistently shows that simple strategies with two or three well-chosen inputs tend to outperform complex strategies with many conditions after going live, because complexity multiplies the overfitting risk at every parameter.
16. The Fix: Walk-Forward Testing
BASIC WALK-FORWARD: Split your historical data 70/30. Use the first 70% (in-sample data) to optimize parameters. Run the final parameters on the last 30% (out-of-sample data) without any further changes whatsoever. If out-of-sample performance is within approximately 20–30% of in-sample performance, there is evidence of a genuine edge. If it collapses, the strategy was fitting to noise.
ROLLING WALK-FORWARD: Optimise on the first six months of data. Test on months 7–9 without changes. Advance: optimize on months 4–9, test on months 10–12. Continue this rolling process across your full dataset. Positive performance maintained across multiple consecutive out-of-sample periods provides the strongest available evidence of a real edge before live deployment.
17. Problem 6: Your Backtest Only Survived One Type of Market
A strategy built and tested on 2020–2023 data has only been exposed to one chapter of market history, one of the most aggressive sustained bull markets ever recorded. EBC Financial Group identified this directly in their April 2026 research: "In a period of elevated interest rates and heightened volatility, strategies that performed smoothly in backtesting struggled dramatically to adapt to conditions they had never encountered."
Before trusting any backtest result, verify that the test period includes all four of the following market conditions:
-
A sustained bull market - prices trending strongly upward for months
-
A significant bear market or correction - prices falling 20%+ and staying below peak
-
A sideways or choppy consolidation period - prices within a range without clear direction
-
A high-volatility event - a crisis, pandemic shock, rate cycle turning point, or geopolitical event
If your backtest does not cover all four, you only know how the strategy behaves in the conditions you happened to include.
Survivorship Bias, The Invisible Distortion
When traders choose which instruments to backtest on, they typically choose the ones that performed well historically, Tesla, Apple, Bitcoin, Ethereum. They do not test on stocks that were delisted, companies that went bankrupt, or crypto projects that went to zero.
The backtest operates on a sample of assets that already survived and thrived. Research from zeiierman.com (January 2026) identifies this specifically: "Relying only on assets that have done well in the past can lead to major disappointments, it's easy to think the market looks great when you're only seeing the success stories."
18. Problem 7: The Gap That No Setting Can Close
There is a final layer of discrepancy between backtest and live performance that no configuration change can fix, because it exists in the trader, not the software.
In a backtest, every signal is followed perfectly. Every stop loss is held exactly where it was placed. Every profit is taken at the specified level. The strategy never second-guesses itself, never hesitates, never cancels an order because the news looks uncertain, and never adds to a losing position because it "feels sure" the trade will recover.
In live trading with real capital, none of those things are guaranteed. PineConnector's 2025 research identified this as a structural component of the gap: "In backtesting, decisions are automated. In live trading, traders may override systems out of fear or greed. Backtesting builds confidence, but live losses can quickly shake it."
When a strategy hits three consecutive losses with real money, the pressure to intervene, to skip the next signal, to move a stop loss to break-even early, to close a position at a smaller loss than the system specifies, is real and powerful for almost every trader. Every manual intervention breaks the statistical edge the backtest was measuring. The edge may be genuine; the execution of it under pressure is imperfect.
There is also operational friction that no backtest captures: internet connectivity issues that cause a missed signal, broker platform outages during high-volatility periods, position size calculations slightly off because the account balance at fill time differed from what the strategy calculated. These operational factors typically add a 2–5% drag on performance that no simulation can model.
After correcting all settings, the Supa.is case study found backtests came within 5–10% of live results. The remaining gap is this psychological and operational residual, entirely expected and built into the target.
19. How to Read Your TradingView Backtest Metrics Correctly
Once you have applied all the fixes above, your backtest will look significantly less impressive. Returns will be lower. The equity curve will be rougher. This is not failure, it is accuracy.
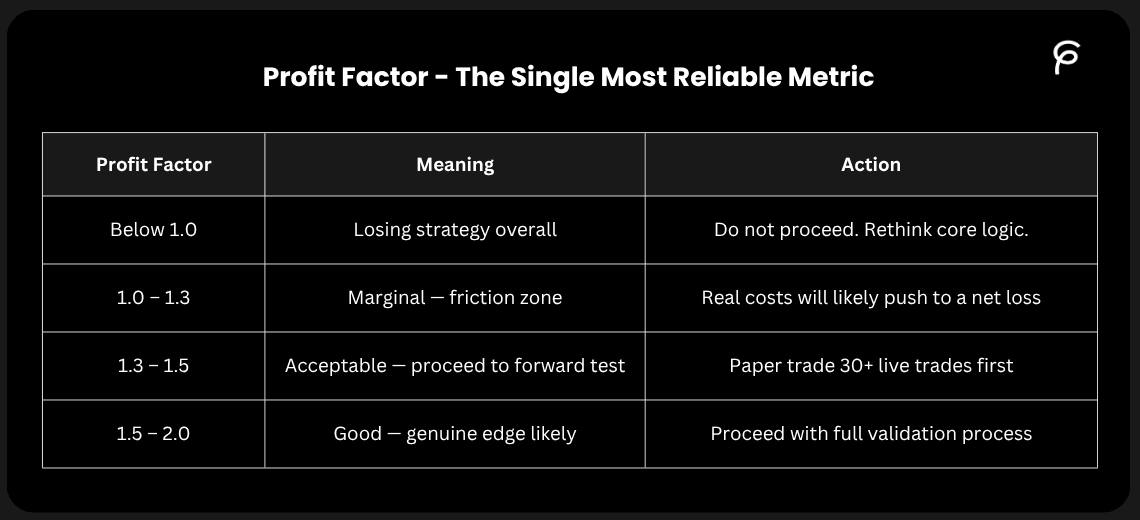
20. Profit Factor - The Single Most Reliable Metric
Profit factor is gross profit divided by gross loss. A profit factor of 1.5 means the strategy made $1.50 for every $1.00 it lost. It is the most reliable single number in the performance report because it captures the relationship between total wins and total losses without the distortions that win rate alone introduces.
21. Win Rate - The Most Misunderstood Metric
Win rate is the percentage of trades that closed profitably. It is also the most misused metric in trading, because it means nothing in isolation.
A 30% win rate is perfectly viable if the average winning trade makes five times what the average losing trade loses, the strategy profits $80 per ten trades.
A 70% win rate can be a catastrophically losing strategy if the average losing trade is three times the average winning trade, the strategy loses $20 per ten trades.
Always read the win rate alongside the average win/loss ratio. Neither number alone tells you whether the strategy has positive expectations.
22. Maximum Drawdown - The Question Is Whether You Can Survive It
Maximum drawdown is the largest peak-to-trough decline during the test period. Most traders overestimate their ability to hold through drawdowns when answering hypothetically. Real drawdowns with real money have a psychological weight that simulated equity curves do not.
-
Under 10%: Manageable for most retail traders
-
10–20%: Challenging but sustainable for experienced traders with strong rules
-
20–30%: Requires exceptional conviction pre-committed before the drawdown begins
-
Above 30%: Very difficult to sustain psychologically in practice
23. Sharpe Ratio - With a Critical Adjustment
Sharpe ratio measures return per unit of risk. The critical caveat: backtested Sharpe ratios typically drop 30–50% in live trading compared to what the backtest reports (financialtechwiz.com, 2026). A Sharpe of 1.5 in backtest may deliver 0.75–1.0 live once execution friction and psychological factors are included. Above 0.75 in a corrected backtest is acceptable for retail systematic traders. Build the 30–50% haircut into your expectations before deployment.
24. Step-by-Step Settings Fix, The Exact Sequence
Apply these changes before reading any backtest number. Right-click your strategy on the chart or click the gear icon in the Strategy Tester panel, then navigate to Properties.
STEP 1 - COMMISSION Change Type to "Percent of order value." Set Value to your actual broker rate. Use 0.1% as a conservative starting point if unknown. For futures, switch to "Currency per contract" and enter the actual round-trip fee (typically $4–5 for ES or NQ).
STEP 2 - SLIPPAGE Change from 0 to a realistic tick value for your specific instrument. Major forex pairs: 2 Liquid crypto on CEX: 3 Crypto on DEX: 10 or more Futures: 1–2 Small-cap stocks or news-event strategies: 5–10
STEP 3 - POSITION SIZING Change Order Size to "% of equity." Set between 1–5% based on your actual intended risk per trade. Set Initial Capital to your actual planned trading amount.
STEP 4 - BAR MAGNIFIER (Plus plan and above) Add use_bar_magnifier=true to your Pine Script strategy declaration. This dramatically improves intrabar simulation accuracy for any strategy running on timeframes below 4 hours.
STEP 5 - LOOKAHEAD BIAS CHECK If your strategy uses request.security(), confirm the lookahead parameter is barmerge.lookahead_off. Any instance of barmerge.lookahead_on gives the strategy access to future data, producing backtest results that are literally impossible to achieve in live trading.
STEP 6 - CALC_ON_EVERY_TICK CHECK Confirm this is set to false (the default). With calc_on_every_tick=true, TradingView processes historical bars differently from real-time bars, making backtest results "completely irrelevant" as a predictor of live performance (tradingcode.net).
STEP 7 - VERIFY TRADE COUNT AND DATA COVERAGE Ensure the backtest generated at least 100 trades. Ensure the data period covers a minimum of three years and includes different market regimes. If TradingView's free plan is limiting your historical data access, the Essential plan (~$14.95/month) unlocks minute-level historical data for intraday strategy testing.
25. Pre-Live Deployment Checklist
Every item on this list has caused real traders to lose real money when skipped.
SETTINGS VERIFIED:
-
Commission matches actual broker rate, not zero
-
Slippage set to realistic tick value for the specific instrument
-
Position sizing set to percentage of equity, not fixed dollar or 100% equity
-
Initial capital set to actual planned trading amount
-
Bar Magnifier enabled for intraday strategies (Plus plan and above)
STATISTICAL VALIDATION COMPLETE:
-
Minimum 100 trades generated (200+ preferred)
-
Data period covers at least 3 years including bull, bear, and sideways conditions
-
Walk-forward validation completed, out-of-sample within 30% of in-sample
-
Profit factor above 1.3 after all realistic costs applied
-
Maximum drawdown within a range sustainable psychologically with real money
TECHNICAL AUDIT DONE:
-
Strategy uses barstate.isconfirmed or calculates only on bar close
-
No request.security() with barmerge.lookahead_on in the code
-
calc_on_every_tick is set to false
FORWARD TESTING COMPLETE:
-
Strategy paper-traded for minimum 30 live trades before real capital deployed
-
Paper trading results within approximately 20% of corrected backtest results
26. Conclusion: Your Backtest Was Never the Enemy, Your Defaults Were
There is a specific moment this article is designed to create. You run your strategy through the corrections described here, you add realistic commission, realistic slippage, percentage-based position sizing, and you watch the equity curve shrink. The 74% annual return becomes 41%. The smooth ascending line gets rougher. And instead of feeling discouraged, you feel something more useful: clarity.
That lower number is the first honest number your backtest has ever shown you.
Every trader who has lost money going from backtest to live trading has experienced a version of the same betrayal: a tool they trusted gave them numbers that described a world that does not exist. Zero commission. Perfect fills. Unlimited leverage. The software was not lying to them, it was simply answering the question they asked rather than the question they needed to ask. The difference between those two questions is the difference between "how would this strategy have performed in an imaginary frictionless market?" and "how would this strategy actually perform in the market I am trading?"
The seven problems covered in this article, zero commission, zero slippage, unrealistic position sizing, the OHLC trap, overfitting, single-regime testing, and the psychology gap, are not seven separate issues. They are seven ways the same core mistake expresses itself: evaluating a strategy under conditions that are easier than real trading. Fix all seven and the number that comes out the other side is the number you can actually use to make decisions.
What that number tells you depends on what it is. A profit factor of 1.1 after all corrections tells you the strategy does not have enough edge to survive live trading, and knowing that before risking capital is enormously valuable. A profit factor of 1.6 after all corrections, validated across diverse market conditions on out-of-sample data, tells you something genuinely worth taking forward. The difference is not the strategy changing. It is the measurement finally becoming accurate.
The most important mindset shift this article asks for is a simple one: stop treating a high backtest number as the goal. A high backtest number on default settings is the easiest thing in the world to produce, you can get one by accident, by coincidence, or by slightly overfitting a strategy to a three-year bull market. It proves nothing. The goal is a realistic backtest number that holds up across different market conditions, survives realistic costs, and remains stable when you look at data the strategy has never seen before. That number is harder to achieve and worth far more when you have it.
27. What to Do When a Strategy Fails the Corrections
Not every strategy will survive this process. Some that looked excellent on default settings will show profit factors below 1.0 after applying realistic commission and slippage. This is not failure, this is the process working exactly as intended. Finding out a strategy cannot survive real costs in a backtest is the right outcome. It is far better than finding out in a live account.
When a corrected backtest reveals a strategy with insufficient edge, there are three productive directions forward.
The first is to investigate whether a different instrument or timeframe changes the cost profile enough to make the strategy viable. A scalping strategy on EURUSD with thin margins may work significantly better on a daily chart with wider targets, where commission and slippage represent a much smaller fraction of each trade's profit. The core logic may be sound, only the execution context is wrong.
The second is to examine whether the strategy's entry logic has genuine merit but the exit logic is reducing the profit factor. Many strategies have solid entry signals but exit too early or too late. Improving exit rules, adding a trailing stop, widening the take profit, or holding winners for a defined number of bars, can meaningfully change the corrected profit factor without touching the entry at all.
The third is to accept that the strategy does not have a real edge and build a new one from a different foundation. This is the hardest path psychologically, because weeks or months of work may feel wasted. But a strategy without genuine edge, deployed with real money, is not weeks of wasted work, it is weeks of wasted work followed by financial losses.
All three paths are more productive than going back to the default settings and looking at the inflated numbers again. The high number of default settings is not the strategy's potential. It is the gap between an imaginary market and a real one. Close that gap in the backtest, and you finally know what you are actually working with.
That is what honest backtesting gives you: not a promise, not a guarantee, but the most accurate picture available of whether an idea has genuine merit before you pay real money to find out. Every correction in this article brings that picture one step closer to reality. All of them together bring it close enough to act on.